| 0 | 1 | 2 | 3 | 4 | 5 | 6 | 7 | 8 | |
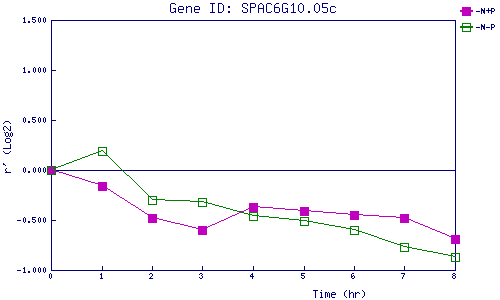
| -N+P | 0.000 | -0.160 | -0.479 | -0.600 | -0.368 | -0.410 | -0.449 | -0.485 | -0.694 |
| -N-P | 0.000 | 0.190 | -0.302 | -0.316 | -0.455 | -0.506 | -0.604 | -0.766 | -0.870 |
|
-N+P: Nitrogen starved in the presence of P-factor -N-P: Nitrogen starved in the absence of P-factor |