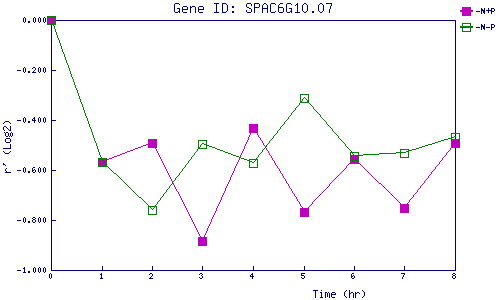
| 0 | 1 | 2 | 3 | 4 | 5 | 6 | 7 | 8 | |
| -N+P | 0.000 | -0.566 | -0.492 | -0.884 | -0.431 | -0.770 | -0.556 | -0.751 | -0.491 |
| -N-P | 0.000 | -0.567 | -0.762 | -0.496 | -0.571 | -0.310 | -0.544 | -0.532 | -0.468 |
|
-N+P: Nitrogen starved in the presence of P-factor -N-P: Nitrogen starved in the absence of P-factor |