ubi3
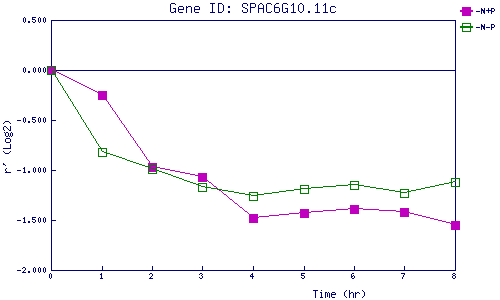
| 0 | 1 | 2 | 3 | 4 | 5 | 6 | 7 | 8 | |
| -N+P | 0.000 | -0.250 | -0.968 | -1.066 | -1.485 | -1.426 | -1.391 | -1.420 | -1.554 |
| -N-P | 0.000 | -0.824 | -0.986 | -1.167 | -1.264 | -1.194 | -1.152 | -1.228 | -1.119 |
|
-N+P: Nitrogen starved in the presence of P-factor -N-P: Nitrogen starved in the absence of P-factor |