ace2
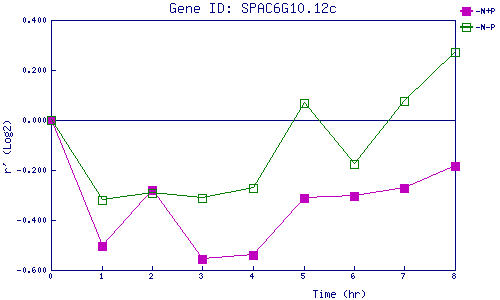
| 0 | 1 | 2 | 3 | 4 | 5 | 6 | 7 | 8 | |
| -N+P | 0.000 | -0.506 | -0.278 | -0.556 | -0.539 | -0.311 | -0.303 | -0.270 | -0.184 |
| -N-P | 0.000 | -0.319 | -0.291 | -0.314 | -0.271 | 0.068 | -0.174 | 0.077 | 0.272 |
|
-N+P: Nitrogen starved in the presence of P-factor -N-P: Nitrogen starved in the absence of P-factor |