| 0 | 1 | 2 | 3 | 4 | 5 | 6 | 7 | 8 | |
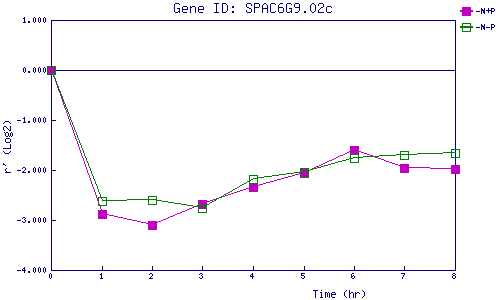
| -N+P | 0.000 | -2.876 | -3.095 | -2.682 | -2.348 | -2.069 | -1.605 | -1.959 | -1.988 |
| -N-P | 0.000 | -2.617 | -2.597 | -2.752 | -2.176 | -2.031 | -1.750 | -1.698 | -1.656 |
|
-N+P: Nitrogen starved in the presence of P-factor -N-P: Nitrogen starved in the absence of P-factor |