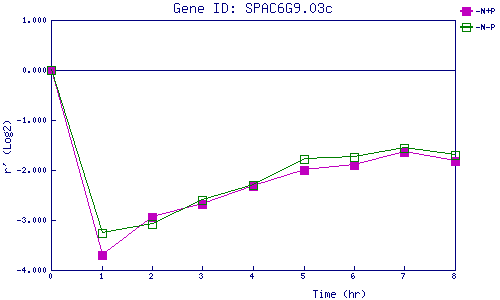
| 0 | 1 | 2 | 3 | 4 | 5 | 6 | 7 | 8 | |
| -N+P | 0.000 | -3.702 | -2.947 | -2.670 | -2.327 | -1.996 | -1.901 | -1.644 | -1.822 |
| -N-P | 0.000 | -3.268 | -3.087 | -2.599 | -2.309 | -1.780 | -1.736 | -1.559 | -1.701 |
|
-N+P: Nitrogen starved in the presence of P-factor -N-P: Nitrogen starved in the absence of P-factor |