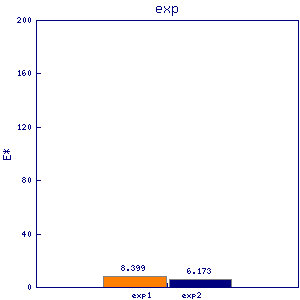
pcp1
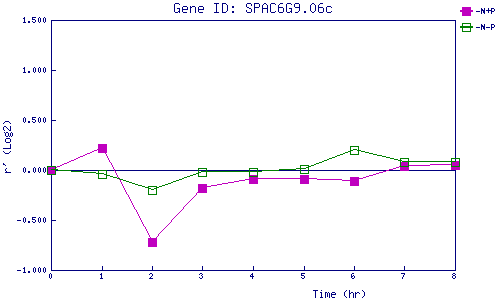
| 0 | 1 | 2 | 3 | 4 | 5 | 6 | 7 | 8 | |
| -N+P | 0.000 | 0.224 | -0.715 | -0.175 | -0.089 | -0.091 | -0.109 | 0.044 | 0.048 |
| -N-P | 0.000 | -0.043 | -0.199 | -0.019 | -0.016 | 0.011 | 0.204 | 0.085 | 0.081 |
|
-N+P: Nitrogen starved in the presence of P-factor -N-P: Nitrogen starved in the absence of P-factor |