reserved_name_ubp6
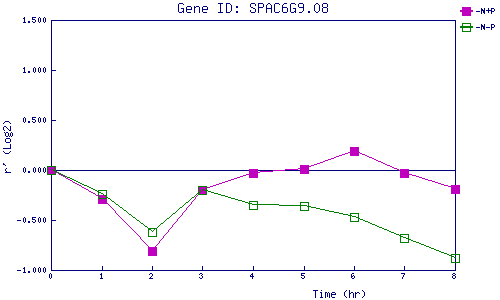
| 0 | 1 | 2 | 3 | 4 | 5 | 6 | 7 | 8 | |
| -N+P | 0.000 | -0.292 | -0.807 | -0.204 | -0.034 | 0.012 | 0.191 | -0.029 | -0.189 |
| -N-P | 0.000 | -0.235 | -0.621 | -0.203 | -0.350 | -0.356 | -0.467 | -0.678 | -0.885 |
|
-N+P: Nitrogen starved in the presence of P-factor -N-P: Nitrogen starved in the absence of P-factor |