rpl24
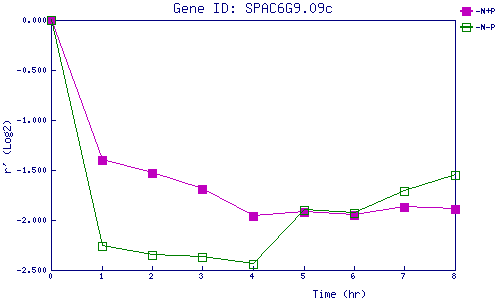
| 0 | 1 | 2 | 3 | 4 | 5 | 6 | 7 | 8 | |
| -N+P | 0.000 | -1.402 | -1.531 | -1.690 | -1.957 | -1.922 | -1.952 | -1.869 | -1.890 |
| -N-P | 0.000 | -2.258 | -2.351 | -2.372 | -2.436 | -1.898 | -1.928 | -1.712 | -1.554 |
|
-N+P: Nitrogen starved in the presence of P-factor -N-P: Nitrogen starved in the absence of P-factor |