sen1
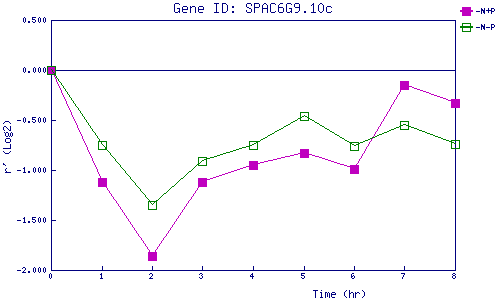
| 0 | 1 | 2 | 3 | 4 | 5 | 6 | 7 | 8 | |
| -N+P | 0.000 | -1.123 | -1.861 | -1.121 | -0.950 | -0.829 | -0.993 | -0.153 | -0.331 |
| -N-P | 0.000 | -0.746 | -1.352 | -0.913 | -0.753 | -0.463 | -0.761 | -0.554 | -0.735 |
|
-N+P: Nitrogen starved in the presence of P-factor -N-P: Nitrogen starved in the absence of P-factor |