syb1 snc1
| 0 | 1 | 2 | 3 | 4 | 5 | 6 | 7 | 8 | |
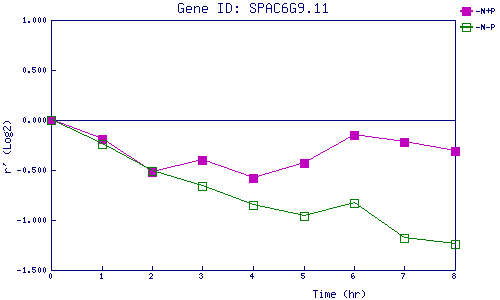
| -N+P | 0.000 | -0.190 | -0.518 | -0.403 | -0.583 | -0.434 | -0.152 | -0.224 | -0.310 |
| -N-P | 0.000 | -0.245 | -0.512 | -0.659 | -0.851 | -0.965 | -0.832 | -1.183 | -1.238 |
|
-N+P: Nitrogen starved in the presence of P-factor -N-P: Nitrogen starved in the absence of P-factor |