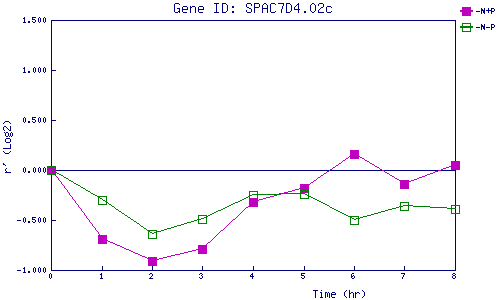
| 0 | 1 | 2 | 3 | 4 | 5 | 6 | 7 | 8 | |
| -N+P | 0.000 | -0.694 | -0.907 | -0.790 | -0.318 | -0.181 | 0.156 | -0.137 | 0.054 |
| -N-P | 0.000 | -0.299 | -0.637 | -0.489 | -0.254 | -0.240 | -0.495 | -0.357 | -0.391 |
|
-N+P: Nitrogen starved in the presence of P-factor -N-P: Nitrogen starved in the absence of P-factor |