Sp-snR02-sno
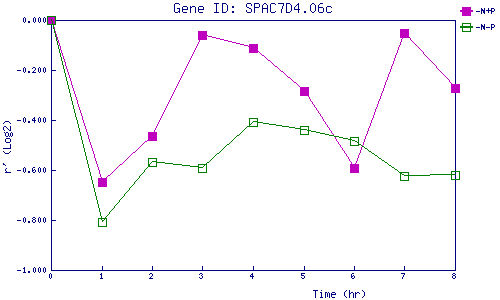
| 0 | 1 | 2 | 3 | 4 | 5 | 6 | 7 | 8 | |
| -N+P | 0.000 | -0.648 | -0.463 | -0.060 | -0.113 | -0.285 | -0.592 | -0.052 | -0.273 |
| -N-P | 0.000 | -0.806 | -0.570 | -0.592 | -0.410 | -0.442 | -0.483 | -0.623 | -0.620 |
|
-N+P: Nitrogen starved in the presence of P-factor -N-P: Nitrogen starved in the absence of P-factor |