trx2
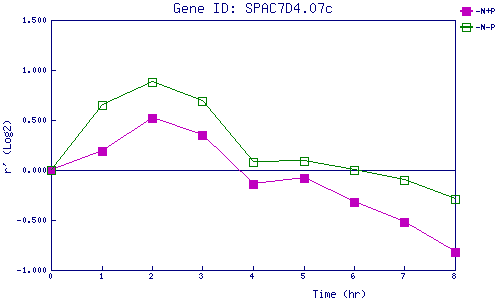
| 0 | 1 | 2 | 3 | 4 | 5 | 6 | 7 | 8 | |
| -N+P | 0.000 | 0.187 | 0.521 | 0.352 | -0.136 | -0.083 | -0.319 | -0.516 | -0.824 |
| -N-P | 0.000 | 0.651 | 0.877 | 0.687 | 0.085 | 0.092 | -0.003 | -0.099 | -0.292 |
|
-N+P: Nitrogen starved in the presence of P-factor -N-P: Nitrogen starved in the absence of P-factor |