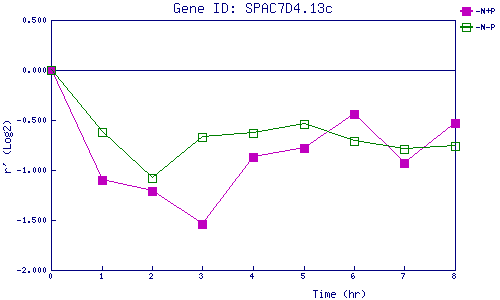
| 0 | 1 | 2 | 3 | 4 | 5 | 6 | 7 | 8 | |
| -N+P | 0.000 | -1.105 | -1.214 | -1.541 | -0.867 | -0.783 | -0.444 | -0.933 | -0.530 |
| -N-P | 0.000 | -0.625 | -1.077 | -0.670 | -0.634 | -0.543 | -0.712 | -0.793 | -0.765 |
|
-N+P: Nitrogen starved in the presence of P-factor -N-P: Nitrogen starved in the absence of P-factor |