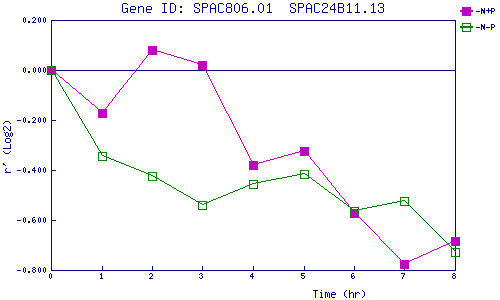
| 0 | 1 | 2 | 3 | 4 | 5 | 6 | 7 | 8 | |
| -N+P | 0.000 | -0.173 | 0.082 | 0.021 | -0.379 | -0.325 | -0.571 | -0.777 | -0.684 |
| -N-P | 0.000 | -0.342 | -0.425 | -0.541 | -0.454 | -0.414 | -0.563 | -0.525 | -0.728 |
|
-N+P: Nitrogen starved in the presence of P-factor -N-P: Nitrogen starved in the absence of P-factor |