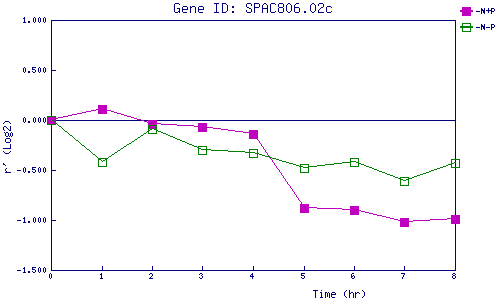
| 0 | 1 | 2 | 3 | 4 | 5 | 6 | 7 | 8 | |
| -N+P | 0.000 | 0.108 | -0.038 | -0.070 | -0.138 | -0.885 | -0.905 | -1.022 | -0.988 |
| -N-P | 0.000 | -0.423 | -0.094 | -0.300 | -0.326 | -0.484 | -0.418 | -0.608 | -0.427 |
|
-N+P: Nitrogen starved in the presence of P-factor -N-P: Nitrogen starved in the absence of P-factor |