rps26 rps2601 rps26-1
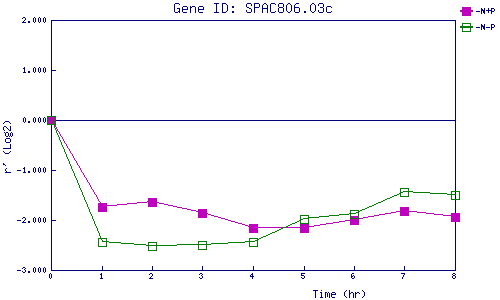
| 0 | 1 | 2 | 3 | 4 | 5 | 6 | 7 | 8 | |
| -N+P | 0.000 | -1.733 | -1.647 | -1.862 | -2.153 | -2.153 | -2.010 | -1.818 | -1.931 |
| -N-P | 0.000 | -2.446 | -2.528 | -2.507 | -2.437 | -1.988 | -1.885 | -1.446 | -1.504 |
|
-N+P: Nitrogen starved in the presence of P-factor -N-P: Nitrogen starved in the absence of P-factor |