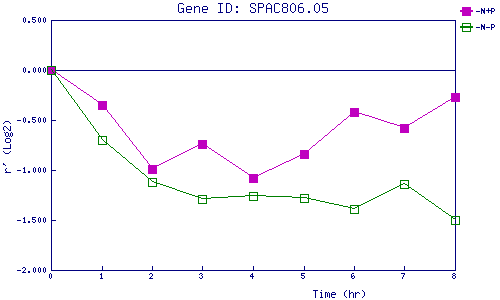
| 0 | 1 | 2 | 3 | 4 | 5 | 6 | 7 | 8 | |
| -N+P | 0.000 | -0.353 | -0.991 | -0.741 | -1.075 | -0.840 | -0.418 | -0.581 | -0.271 |
| -N-P | 0.000 | -0.695 | -1.124 | -1.286 | -1.265 | -1.277 | -1.388 | -1.136 | -1.501 |
|
-N+P: Nitrogen starved in the presence of P-factor -N-P: Nitrogen starved in the absence of P-factor |