| 0 | 1 | 2 | 3 | 4 | 5 | 6 | 7 | 8 | |
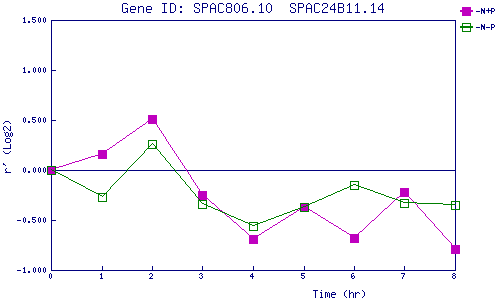
| -N+P | 0.000 | 0.164 | 0.514 | -0.249 | -0.694 | -0.371 | -0.682 | -0.218 | -0.793 |
| -N-P | 0.000 | -0.271 | 0.256 | -0.338 | -0.555 | -0.369 | -0.147 | -0.327 | -0.350 |
|
-N+P: Nitrogen starved in the presence of P-factor -N-P: Nitrogen starved in the absence of P-factor |