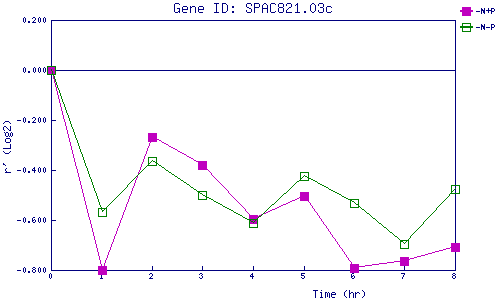
| 0 | 1 | 2 | 3 | 4 | 5 | 6 | 7 | 8 | |
| -N+P | 0.000 | -0.800 | -0.268 | -0.380 | -0.597 | -0.502 | -0.794 | -0.764 | -0.707 |
| -N-P | 0.000 | -0.569 | -0.365 | -0.500 | -0.613 | -0.425 | -0.531 | -0.698 | -0.475 |
|
-N+P: Nitrogen starved in the presence of P-factor -N-P: Nitrogen starved in the absence of P-factor |