cid13 U3snRNA
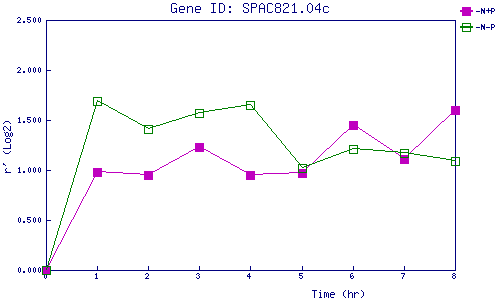
| 0 | 1 | 2 | 3 | 4 | 5 | 6 | 7 | 8 | |
| -N+P | 0.000 | 0.984 | 0.951 | 1.231 | 0.954 | 0.969 | 1.453 | 1.108 | 1.605 |
| -N-P | 0.000 | 1.695 | 1.406 | 1.573 | 1.649 | 1.017 | 1.208 | 1.170 | 1.087 |
|
-N+P: Nitrogen starved in the presence of P-factor -N-P: Nitrogen starved in the absence of P-factor |