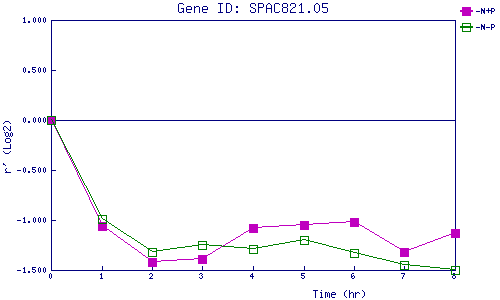
| 0 | 1 | 2 | 3 | 4 | 5 | 6 | 7 | 8 | |
| -N+P | 0.000 | -1.060 | -1.415 | -1.387 | -1.078 | -1.053 | -1.023 | -1.316 | -1.132 |
| -N-P | 0.000 | -0.994 | -1.317 | -1.251 | -1.291 | -1.198 | -1.326 | -1.446 | -1.498 |
|
-N+P: Nitrogen starved in the presence of P-factor -N-P: Nitrogen starved in the absence of P-factor |