slp1
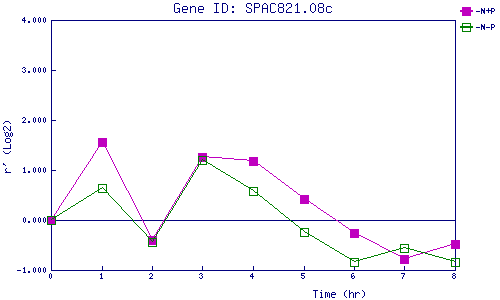
| 0 | 1 | 2 | 3 | 4 | 5 | 6 | 7 | 8 | |
| -N+P | 0.000 | 1.557 | -0.395 | 1.264 | 1.181 | 0.416 | -0.254 | -0.777 | -0.486 |
| -N-P | 0.000 | 0.650 | -0.441 | 1.208 | 0.586 | -0.233 | -0.840 | -0.568 | -0.832 |
|
-N+P: Nitrogen starved in the presence of P-factor -N-P: Nitrogen starved in the absence of P-factor |