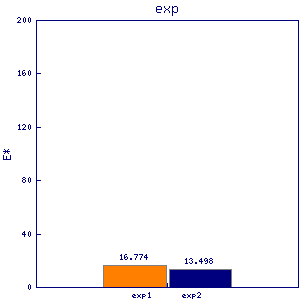
eng1
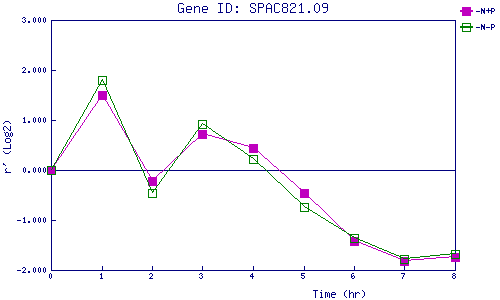
| 0 | 1 | 2 | 3 | 4 | 5 | 6 | 7 | 8 | |
| -N+P | 0.000 | 1.505 | -0.216 | 0.721 | 0.440 | -0.464 | -1.427 | -1.818 | -1.749 |
| -N-P | 0.000 | 1.801 | -0.459 | 0.923 | 0.217 | -0.742 | -1.370 | -1.782 | -1.691 |
|
-N+P: Nitrogen starved in the presence of P-factor -N-P: Nitrogen starved in the absence of P-factor |