pro1
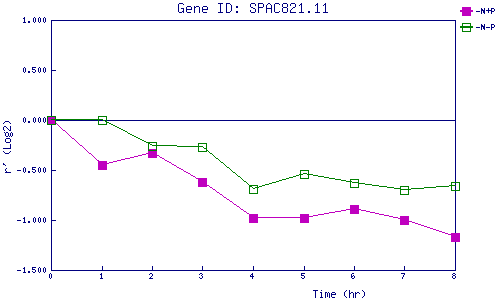
| 0 | 1 | 2 | 3 | 4 | 5 | 6 | 7 | 8 | |
| -N+P | 0.000 | -0.447 | -0.331 | -0.618 | -0.983 | -0.982 | -0.888 | -1.002 | -1.166 |
| -N-P | 0.000 | -0.004 | -0.256 | -0.267 | -0.692 | -0.544 | -0.630 | -0.700 | -0.655 |
|
-N+P: Nitrogen starved in the presence of P-factor -N-P: Nitrogen starved in the absence of P-factor |