tif33
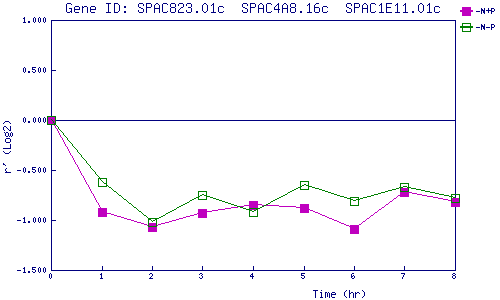
| 0 | 1 | 2 | 3 | 4 | 5 | 6 | 7 | 8 | |
| -N+P | 0.000 | -0.923 | -1.070 | -0.929 | -0.847 | -0.877 | -1.086 | -0.721 | -0.823 |
| -N-P | 0.000 | -0.619 | -1.025 | -0.754 | -0.922 | -0.649 | -0.811 | -0.670 | -0.775 |
|
-N+P: Nitrogen starved in the presence of P-factor -N-P: Nitrogen starved in the absence of P-factor |
Return to Microarray Home