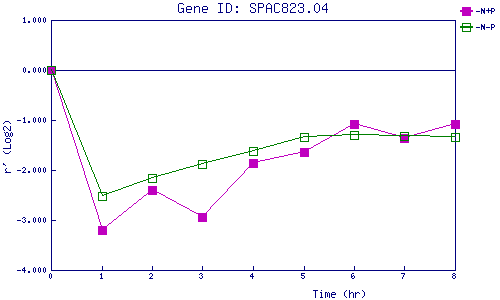
| 0 | 1 | 2 | 3 | 4 | 5 | 6 | 7 | 8 | |
| -N+P | 0.000 | -3.195 | -2.395 | -2.939 | -1.860 | -1.650 | -1.072 | -1.369 | -1.088 |
| -N-P | 0.000 | -2.527 | -2.155 | -1.873 | -1.616 | -1.344 | -1.299 | -1.326 | -1.341 |
|
-N+P: Nitrogen starved in the presence of P-factor -N-P: Nitrogen starved in the absence of P-factor |