| 0 | 1 | 2 | 3 | 4 | 5 | 6 | 7 | 8 | |
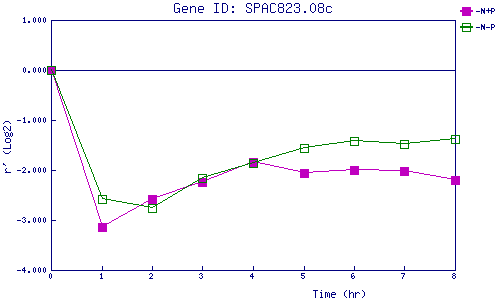
| -N+P | 0.000 | -3.131 | -2.579 | -2.246 | -1.849 | -2.064 | -2.005 | -2.013 | -2.191 |
| -N-P | 0.000 | -2.584 | -2.763 | -2.155 | -1.867 | -1.564 | -1.429 | -1.473 | -1.374 |
|
-N+P: Nitrogen starved in the presence of P-factor -N-P: Nitrogen starved in the absence of P-factor |