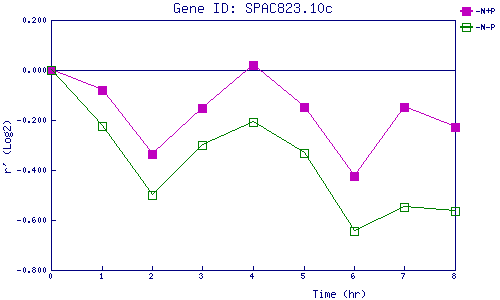
| 0 | 1 | 2 | 3 | 4 | 5 | 6 | 7 | 8 | |
| -N+P | 0.000 | -0.081 | -0.337 | -0.153 | 0.019 | -0.149 | -0.424 | -0.148 | -0.229 |
| -N-P | 0.000 | -0.222 | -0.501 | -0.300 | -0.209 | -0.333 | -0.643 | -0.549 | -0.565 |
|
-N+P: Nitrogen starved in the presence of P-factor -N-P: Nitrogen starved in the absence of P-factor |