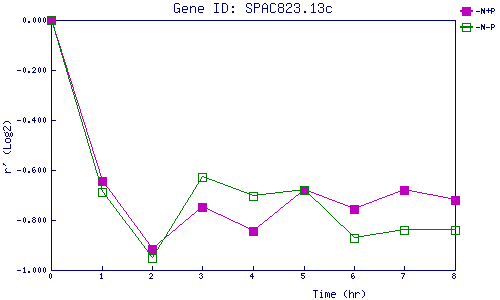
| 0 | 1 | 2 | 3 | 4 | 5 | 6 | 7 | 8 | |
| -N+P | 0.000 | -0.644 | -0.916 | -0.748 | -0.844 | -0.680 | -0.755 | -0.679 | -0.722 |
| -N-P | 0.000 | -0.688 | -0.950 | -0.629 | -0.702 | -0.679 | -0.871 | -0.839 | -0.838 |
|
-N+P: Nitrogen starved in the presence of P-factor -N-P: Nitrogen starved in the absence of P-factor |