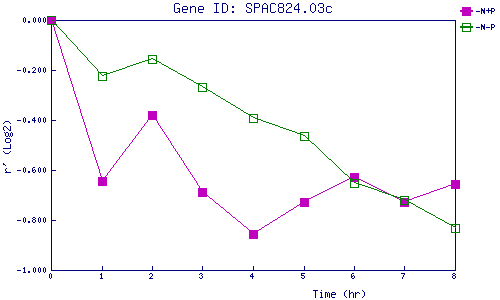
| 0 | 1 | 2 | 3 | 4 | 5 | 6 | 7 | 8 | |
| -N+P | 0.000 | -0.644 | -0.380 | -0.690 | -0.857 | -0.726 | -0.629 | -0.728 | -0.654 |
| -N-P | 0.000 | -0.223 | -0.155 | -0.267 | -0.393 | -0.463 | -0.653 | -0.720 | -0.831 |
|
-N+P: Nitrogen starved in the presence of P-factor -N-P: Nitrogen starved in the absence of P-factor |