| 0 | 1 | 2 | 3 | 4 | 5 | 6 | 7 | 8 | |
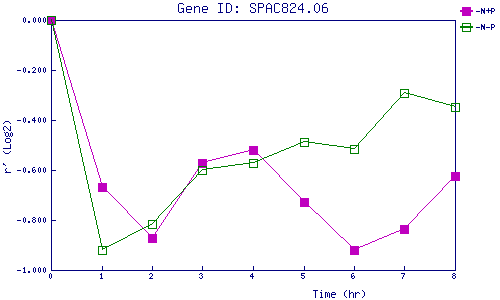
| -N+P | 0.000 | -0.668 | -0.874 | -0.572 | -0.522 | -0.729 | -0.920 | -0.836 | -0.624 |
| -N-P | 0.000 | -0.919 | -0.817 | -0.601 | -0.571 | -0.487 | -0.516 | -0.291 | -0.349 |
|
-N+P: Nitrogen starved in the presence of P-factor -N-P: Nitrogen starved in the absence of P-factor |