gda1 gdp1
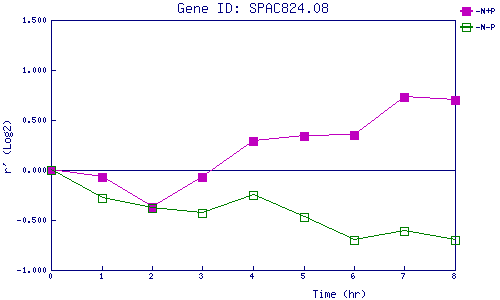
| 0 | 1 | 2 | 3 | 4 | 5 | 6 | 7 | 8 | |
| -N+P | 0.000 | -0.067 | -0.370 | -0.071 | 0.291 | 0.341 | 0.350 | 0.731 | 0.698 |
| -N-P | 0.000 | -0.280 | -0.383 | -0.432 | -0.246 | -0.468 | -0.699 | -0.611 | -0.697 |
|
-N+P: Nitrogen starved in the presence of P-factor -N-P: Nitrogen starved in the absence of P-factor |