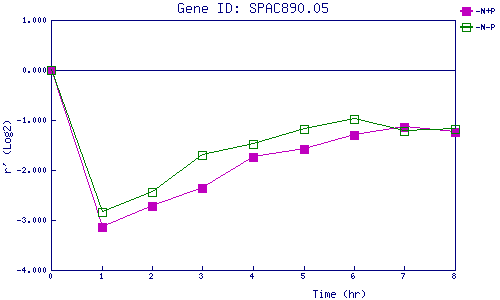
| 0 | 1 | 2 | 3 | 4 | 5 | 6 | 7 | 8 | |
| -N+P | 0.000 | -3.132 | -2.715 | -2.369 | -1.743 | -1.586 | -1.304 | -1.145 | -1.231 |
| -N-P | 0.000 | -2.833 | -2.440 | -1.702 | -1.473 | -1.176 | -0.988 | -1.212 | -1.184 |
|
-N+P: Nitrogen starved in the presence of P-factor -N-P: Nitrogen starved in the absence of P-factor |