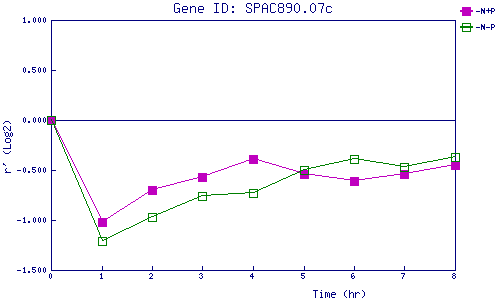
| 0 | 1 | 2 | 3 | 4 | 5 | 6 | 7 | 8 | |
| -N+P | 0.000 | -1.025 | -0.702 | -0.569 | -0.386 | -0.545 | -0.614 | -0.535 | -0.453 |
| -N-P | 0.000 | -1.211 | -0.973 | -0.761 | -0.730 | -0.499 | -0.393 | -0.468 | -0.369 |
|
-N+P: Nitrogen starved in the presence of P-factor -N-P: Nitrogen starved in the absence of P-factor |