rpl31
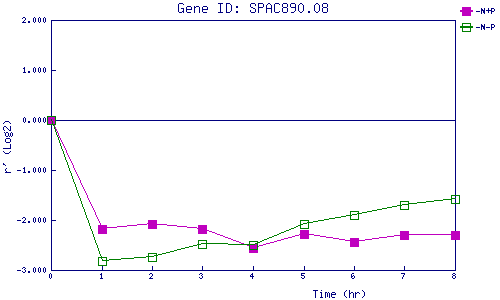
| 0 | 1 | 2 | 3 | 4 | 5 | 6 | 7 | 8 | |
| -N+P | 0.000 | -2.176 | -2.073 | -2.188 | -2.554 | -2.284 | -2.438 | -2.294 | -2.298 |
| -N-P | 0.000 | -2.819 | -2.742 | -2.478 | -2.495 | -2.090 | -1.899 | -1.699 | -1.587 |
|
-N+P: Nitrogen starved in the presence of P-factor -N-P: Nitrogen starved in the absence of P-factor |