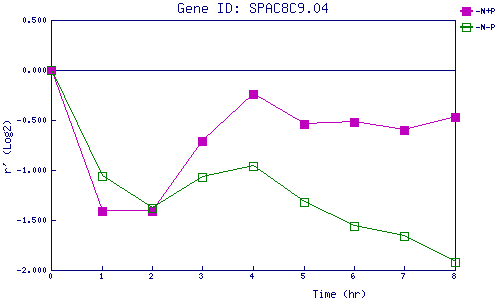
| 0 | 1 | 2 | 3 | 4 | 5 | 6 | 7 | 8 | |
| -N+P | 0.000 | -1.407 | -1.410 | -0.706 | -0.237 | -0.544 | -0.515 | -0.600 | -0.474 |
| -N-P | 0.000 | -1.059 | -1.385 | -1.069 | -0.964 | -1.322 | -1.558 | -1.658 | -1.920 |
|
-N+P: Nitrogen starved in the presence of P-factor -N-P: Nitrogen starved in the absence of P-factor |