| 0 | 1 | 2 | 3 | 4 | 5 | 6 | 7 | 8 | |
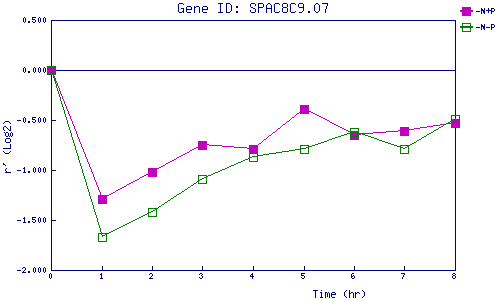
| -N+P | 0.000 | -1.290 | -1.017 | -0.750 | -0.794 | -0.393 | -0.647 | -0.609 | -0.532 |
| -N-P | 0.000 | -1.673 | -1.417 | -1.089 | -0.874 | -0.792 | -0.621 | -0.792 | -0.491 |
|
-N+P: Nitrogen starved in the presence of P-factor -N-P: Nitrogen starved in the absence of P-factor |