rps5
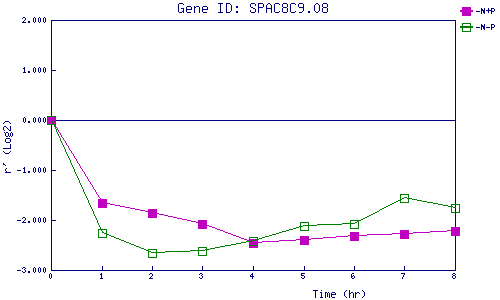
| 0 | 1 | 2 | 3 | 4 | 5 | 6 | 7 | 8 | |
| -N+P | 0.000 | -1.665 | -1.862 | -2.081 | -2.460 | -2.396 | -2.328 | -2.285 | -2.225 |
| -N-P | 0.000 | -2.260 | -2.662 | -2.625 | -2.420 | -2.122 | -2.082 | -1.553 | -1.751 |
|
-N+P: Nitrogen starved in the presence of P-factor -N-P: Nitrogen starved in the absence of P-factor |