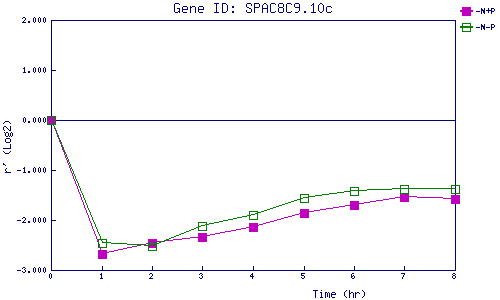
| 0 | 1 | 2 | 3 | 4 | 5 | 6 | 7 | 8 | |
| -N+P | 0.000 | -2.675 | -2.470 | -2.332 | -2.149 | -1.868 | -1.698 | -1.537 | -1.571 |
| -N-P | 0.000 | -2.469 | -2.510 | -2.120 | -1.904 | -1.551 | -1.412 | -1.379 | -1.388 |
|
-N+P: Nitrogen starved in the presence of P-factor -N-P: Nitrogen starved in the absence of P-factor |