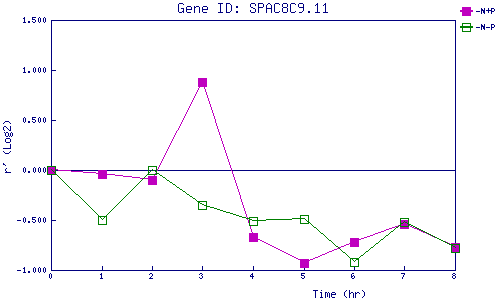
| 0 | 1 | 2 | 3 | 4 | 5 | 6 | 7 | 8 | |
| -N+P | 0.000 | -0.035 | -0.101 | 0.884 | -0.673 | -0.931 | -0.718 | -0.544 | -0.767 |
| -N-P | 0.000 | -0.499 | -0.003 | -0.347 | -0.513 | -0.488 | -0.922 | -0.515 | -0.780 |
|
-N+P: Nitrogen starved in the presence of P-factor -N-P: Nitrogen starved in the absence of P-factor |