tif225
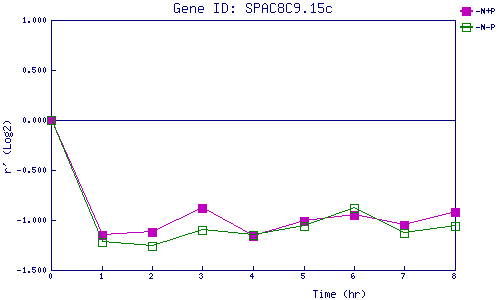
| 0 | 1 | 2 | 3 | 4 | 5 | 6 | 7 | 8 | |
| -N+P | 0.000 | -1.153 | -1.121 | -0.876 | -1.157 | -1.009 | -0.947 | -1.050 | -0.921 |
| -N-P | 0.000 | -1.218 | -1.256 | -1.099 | -1.146 | -1.057 | -0.878 | -1.134 | -1.064 |
|
-N+P: Nitrogen starved in the presence of P-factor -N-P: Nitrogen starved in the absence of P-factor |