| 0 | 1 | 2 | 3 | 4 | 5 | 6 | 7 | 8 | |
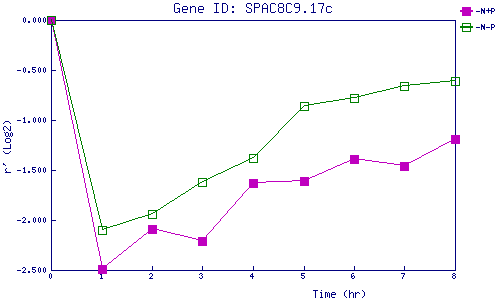
| -N+P | 0.000 | -2.488 | -2.088 | -2.206 | -1.631 | -1.612 | -1.393 | -1.461 | -1.190 |
| -N-P | 0.000 | -2.100 | -1.941 | -1.624 | -1.380 | -0.859 | -0.777 | -0.665 | -0.610 |
|
-N+P: Nitrogen starved in the presence of P-factor -N-P: Nitrogen starved in the absence of P-factor |