rad24
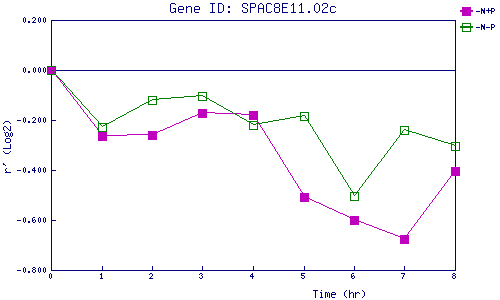
| 0 | 1 | 2 | 3 | 4 | 5 | 6 | 7 | 8 | |
| -N+P | 0.000 | -0.266 | -0.261 | -0.172 | -0.180 | -0.507 | -0.600 | -0.677 | -0.403 |
| -N-P | 0.000 | -0.229 | -0.119 | -0.105 | -0.219 | -0.182 | -0.504 | -0.240 | -0.302 |
|
-N+P: Nitrogen starved in the presence of P-factor -N-P: Nitrogen starved in the absence of P-factor |