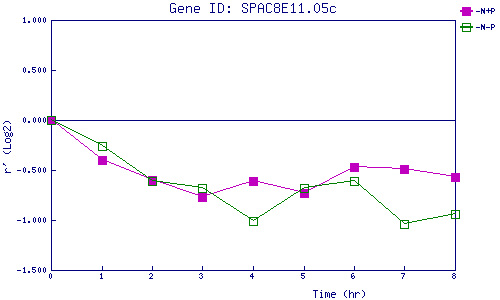
| 0 | 1 | 2 | 3 | 4 | 5 | 6 | 7 | 8 | |
| -N+P | 0.000 | -0.404 | -0.605 | -0.767 | -0.611 | -0.730 | -0.467 | -0.490 | -0.566 |
| -N-P | 0.000 | -0.261 | -0.612 | -0.681 | -1.009 | -0.683 | -0.613 | -1.045 | -0.936 |
|
-N+P: Nitrogen starved in the presence of P-factor -N-P: Nitrogen starved in the absence of P-factor |