alp31
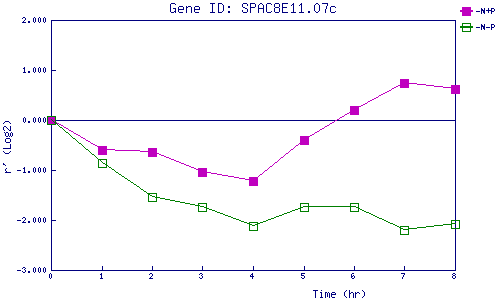
| 0 | 1 | 2 | 3 | 4 | 5 | 6 | 7 | 8 | |
| -N+P | 0.000 | -0.600 | -0.646 | -1.036 | -1.227 | -0.408 | 0.209 | 0.741 | 0.625 |
| -N-P | 0.000 | -0.856 | -1.547 | -1.743 | -2.118 | -1.739 | -1.744 | -2.207 | -2.071 |
|
-N+P: Nitrogen starved in the presence of P-factor -N-P: Nitrogen starved in the absence of P-factor |