sou1
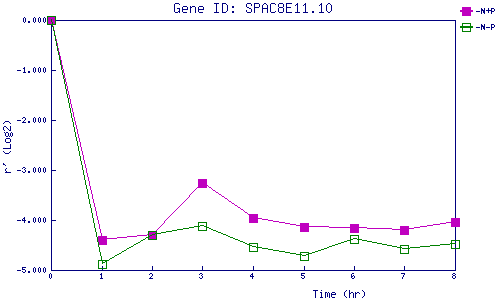
| 0 | 1 | 2 | 3 | 4 | 5 | 6 | 7 | 8 | |
| -N+P | 0.000 | -4.397 | -4.295 | -3.258 | -3.951 | -4.140 | -4.155 | -4.200 | -4.041 |
| -N-P | 0.000 | -4.880 | -4.291 | -4.127 | -4.531 | -4.729 | -4.386 | -4.584 | -4.487 |
|
-N+P: Nitrogen starved in the presence of P-factor -N-P: Nitrogen starved in the absence of P-factor |