| 0 | 1 | 2 | 3 | 4 | 5 | 6 | 7 | 8 | |
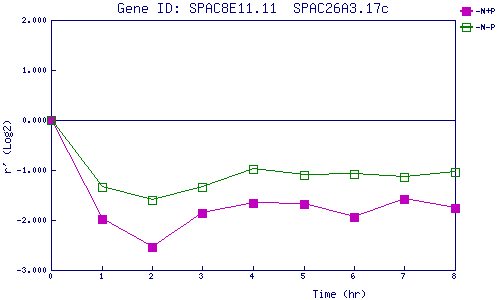
| -N+P | 0.000 | -1.972 | -2.544 | -1.861 | -1.658 | -1.682 | -1.944 | -1.572 | -1.756 |
| -N-P | 0.000 | -1.343 | -1.594 | -1.336 | -0.982 | -1.100 | -1.072 | -1.138 | -1.039 |
|
-N+P: Nitrogen starved in the presence of P-factor -N-P: Nitrogen starved in the absence of P-factor |