| 0 | 1 | 2 | 3 | 4 | 5 | 6 | 7 | 8 | |
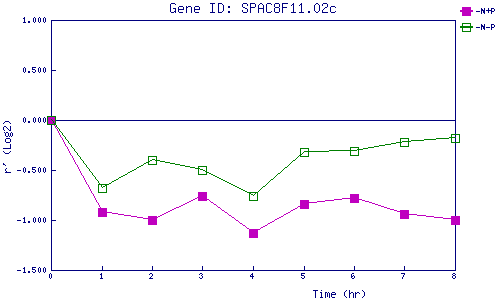
| -N+P | 0.000 | -0.917 | -1.004 | -0.765 | -1.128 | -0.841 | -0.781 | -0.935 | -1.001 |
| -N-P | 0.000 | -0.681 | -0.403 | -0.499 | -0.762 | -0.318 | -0.309 | -0.217 | -0.180 |
|
-N+P: Nitrogen starved in the presence of P-factor -N-P: Nitrogen starved in the absence of P-factor |